Section 1.5
Theory Based Approach
Section 1.5 Learning Objectives
Describe the sampling distribution of a statistic and define the standard error.
Know when/why simulation and theory will yield different results.
Simulation
So far, we’ve used a simulation-based approach to gather strength of evidence.
- Effective
- Relatively easy
But…
- Can be tedious
- Not always practical in real life
- Enter: Theory!
The Theory-Based Approach
- Used when computers weren’t a thing
- Allows prediction of the null distribution shape (aka, pattern)
- Gives us p-values and standardized statistics
- Should get the same or similar results as simulation
The Null Distribution (in depth!)
- Sometimes, data follows a known distribution
- Commonly, we assume data follows the normal distribution
- The normal distribution is one of many known patterns that data can follow
- We always assume the null distribution is normally distributed
The Null Distribution (in depth!)
Since we know the null distribution is normally distributed, we know the following:
- Bell shaped
- Centered at the hypothesized value for \pi
- Can predict standard deviation
- Without the Applet!
Example Null Distribution

Why does sample size matter?
If sample size is too small:
- Theory-based approach will not be accurate
- Can’t tell if data is normally distributed
Theory-based “rule of thumb”:
- Need at least 10 successes and 10 failures
To illustrate…
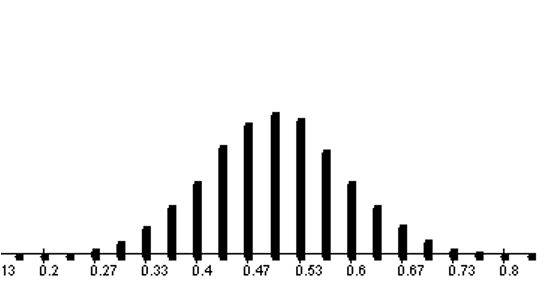
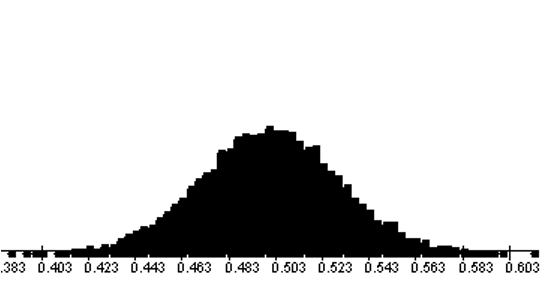
- Both are centered at 0.50
- Left graph n = 30
- Right graph n = 300
Central Limit Theorem
- “Backbone” of statistics
Definition:
- If the sample size (n) is large enough, the distribution of the sample proportions will be bell-shaped (approximately normal), centered at the long run probability (\pi), with a standard deviation:
standard\: deviation\: of\: the\: null=\sqrt{\frac{\pi(1-\pi)}{n}}
Using Theory for Standardized Values
Replace S.D. with theory-based calculation
z=\frac{Observed\: Statistic - Hypothesized\: Value}{Standard\: Deviation\: under\: the\: null}
=\frac{\hat{p}-\pi}{\sqrt{\frac{\pi(1-\pi)}{n}}}
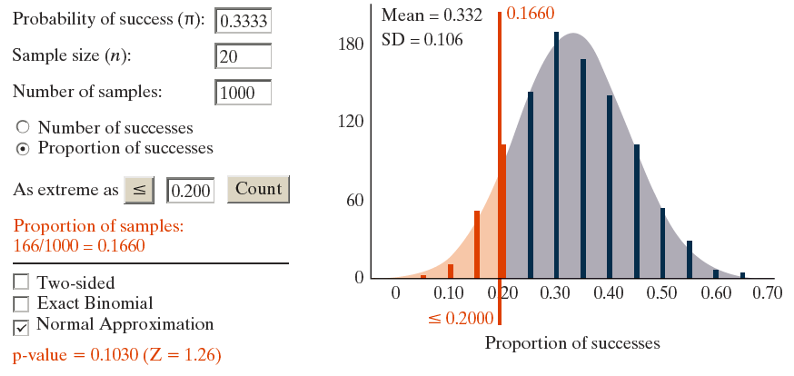
Using the Applet
We can still use the One Proportion Applet for the theory-based approach
- Check “Normal Approximation” box
- Applet fits a normal curve to the data
In more advanced classes, we use calculus to get these values.
Using the Applet
Example: Halloween Treats
Halloween Treats
Let’s identify the following:
Sample & size
Variable of interest
Parameter & symbol
Observed statistic & symbol
Hypotheses (in symbols)
Do we meet the criteria for the theory-based approach?
| Scenario: |
|---|
| Researchers investigated whether children might be as tempted by toys as by candy for Halloween treats. Test households offered two plates to children: one with candy and one with a small toy. They observed the selections of 283 children that night and found that 148 of the kids chose candy. |
Halloween Treats
Sample & size: n = 283 kids
Variable of interest: Chose candy or not
Parameter & symbol: \pi = long run proportion of kids that chose candy
Observed statistic & symbol: \hat{p} = \frac{148}{283}
Hypotheses (in symbols):
- H_{0}: \pi = 0.5
- H_{A}: \pi ≠ 0.5
Do we meet the criteria for the theory-based approach? Yes! More than 10 failures & successes.
Halloween Treats
Standard deviation using theory:
standard\: deviation\: of\: the\: null=\sqrt{\frac{\pi(1-\pi)}{n}}
=\sqrt{\frac{0.5(1-0.5)}{283}}=0.0297
Halloween Treats
Then, we use the calculated standard deviation to obtain the standardized statistic:
standardized\: statistic\: =\frac{0.523-0.5}{0.0297}=0.774
Halloween Treats
Now we find the standardized statistic with the simulation approach:
standardized\: statistic\: =\frac{0.523-0.5}{0.02}=0.793
Notice, we get nearly the same number!
Halloween Treats Conclusion
Since our standardized statistic using either approach is not outside the twos, we conclude the following:
“We do not have enough evidence to conclude that the long-run proportion of kids who choose candy differs from 0.5.”
Investigation: Tire Story Falls Flat
![]()